

The issue
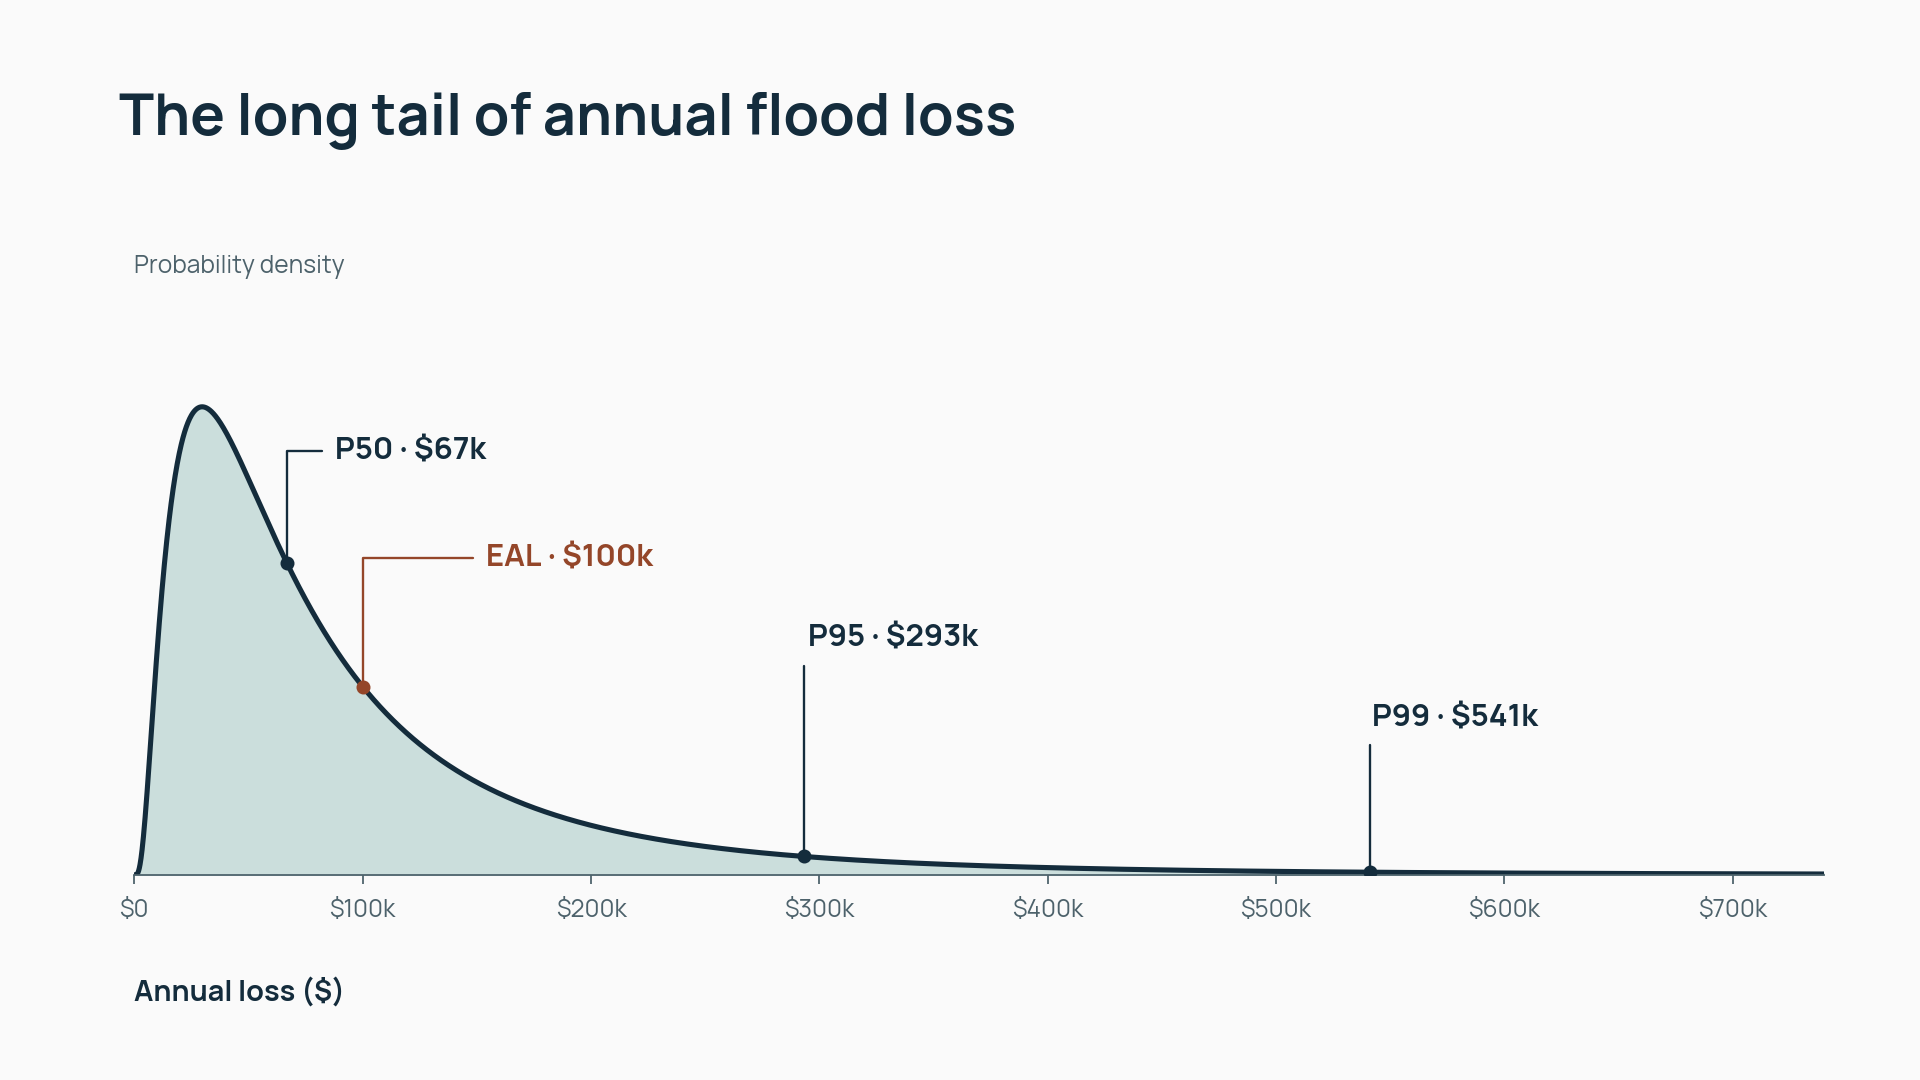
Consider two production sites, each with an expected annual flood loss of $100,000. At the first, shallow flooding causes a $100,000 loss every year. At the second, there is a 1% chance each year of a $10 million loss and otherwise no loss. In this simplified example, the average is the same. A company that can absorb $500,000 but would struggle to finance a prolonged shutdown has good reason to treat the sites differently.
A probability distribution describes the possible losses and the likelihood of each. Expected annual loss is its average. The same distribution can also tell management how likely losses are to exceed its cash reserve. Both estimates depend on the period and climate assumptions used to calculate them.2
Climate change adds deep uncertainty. Analysts may have enough evidence to estimate flood losses under a particular warming scenario, yet lack a sound basis for assigning probabilities to competing futures. They may also disagree about how a catchment will respond to heavier rainfall. A practical approach is to estimate losses within each plausible future and test whether the investment decision changes across them.1
Why should businesses care?
Suppose the owner of the second site is deciding whether to elevate electrical equipment during a scheduled shutdown. Three modelling approaches answer different questions.
- Deterministic analysis fixes the inputs. For a flood of a specified depth and duration, engineers estimate repair costs and downtime with and without the upgrade. This shows whether the design protects the equipment under those conditions.
- Probabilistic analysis considers a range of flood severities and their likelihoods. It can estimate how much the upgrade reduces average annual loss and the chance of a loss above $500,000. Those measures can favour different investments.
- Stochastic modelling is a form of probabilistic analysis. It can simulate sequences of events over the asset’s life. Two floods during the same recovery period can put more pressure on cash than two floods years apart. Modelling the sequence helps an owner decide how long it can afford to defer the upgrade.23
The end user determines which output matters. A corporate risk manager may need the chance that downtime exceeds the company’s ten-day tolerance to decide whether to arrange backup production. A financial risk engineer may need to know how much loss the company retains in severe years after deductibles and policy limits, and how sensitive that estimate is to the damage assumptions. An investment portfolio manager needs to understand whether the same flood could disrupt several holdings at once, how that would affect portfolio cash flows and where protection would make the greatest difference over the holding period.
What should businesses be doing?
- Set the decision threshold.
- Specify the loss or interruption the business can absorb and the period over which it matters.
- Match the model to the decision.
- Test a defined event for design adequacy. Estimate loss probabilities when the decision depends on how often a threshold is crossed.
- Model event sequences when recovery time or the timing of investment affects the outcome.
- Challenge the assumptions that drive the result.
- Connect the result to capital planning.
- Compare the cost of acting now with the losses retained by waiting. If the decision is to defer, identify what evidence would bring the investment forward.
References
- IPCC — Decision-Making Options for Managing Risk, Chapter 17, Climate Change 2022: Impacts, Adaptation and Vulnerability.
- U.S. Army Corps of Engineers, Hydrologic Engineering Center — Expected Annual Damage.
- Oasis Loss Modelling Framework — Standardizing Catastrophe Model Validation.