Energy Transition

From transition pathways to investment plans.

A transition plan defines the direction of change. Delivering it requires decisions about technology, operating models, capital expenditure and timing.

eddyline helps companies compare transition pathways, understand their financial consequences and establish an investment plan that works within the realities of the business.


Compare the pathways

Establish priorities. Compare the pathways.

There is rarely one route to meet energy and climate objectives.

Different pathways create different demands on capital, operating costs and financial performance. The order and timing of investments can be as important as the technologies themselves.

We help companies assess available measures, compare credible pathways and identify where investment creates the strongest case for action.

  1. 01

    Technical evidence

    Climate · Engineering · Operations · Data

  2. 02

    Business consequence

    What changes if the risk materialises?

  3. 03

    Response options

    What realistic interventions exist?

  4. 04

    Economics

    Cost · Value · Risk · Optionality

  5. 05

    Capital priority

    Timing · Sequencing · Portfolio fit

Investment decisionFund · Stage · Wait · Preserve option
Cost and timing

Understand the capital each pathway requires.

A pathway needs more than an emissions trajectory. It needs a credible capital profile.

What must be invested? When will the expenditure occur? How will different choices affect future operating costs and the total cost of transition?

We model these requirements across alternative pathways, making the financial consequences of timing and delay visible.

When does the change happen?

Emissions index (2025 = 100) by dated horizon, 2025–2050Fictional illustrations across 2025, 2030, 2035, 2040, 2045, 2050. Immediate Action: 100, 68, 45, 24, 10, 0; Delayed Action: 100, 91, 81, 59, 34, 12. Fictional illustrative indices, not currency, forecasts or client results. The annual series is interpolated between the plotted dates.Emissions index (2025 = 100)050100202520302035204020452050Emissions index (2025 = 100) by dated horizon, 2025–2050Fictional illustrations across 2025, 2030, 2035, 2040, 2045, 2050. Immediate Action: 100, 68, 45, 24, 10, 0; Delayed Action: 100, 91, 81, 59, 34, 12. Fictional illustrative indices, not currency, forecasts or client results. The annual series is interpolated between the plotted dates.Emissions index (2025 = 100)050100202520302035204020452050
Immediate ActionDelayed Action

How much and by when is capital required?

Annual expenditure index by dated horizon, 2025–2050Fictional illustrations across 2025, 2030, 2035, 2040, 2045, 2050. Immediate Action: 85, 75, 48, 35, 25, 20; Delayed Action: 25, 25, 30, 68, 92, 100. Fictional illustrative indices, not currency, forecasts or client results. The annual series is interpolated between the plotted dates.Annual expenditure index0501008575483525202525306892100202520302035204020452050Annual expenditure index by dated horizon, 2025–2050Fictional illustrations across 2025, 2030, 2035, 2040, 2045, 2050. Immediate Action: 85, 75, 48, 35, 25, 20; Delayed Action: 25, 25, 30, 68, 92, 100. Fictional illustrative indices, not currency, forecasts or client results. The annual series is interpolated between the plotted dates.Annual expenditure index0501008575483525202525306892100202520302035204020452050
Immediate ActionDelayed Action

Both illustrative pathways are shown.

Can your project substantiate its clean energy credits?

Canada’s clean economy investment tax credits (ITCs) and credits under the Clean Fuel Regulations can improve project returns. The optimizer helps you assess ITC eligibility, project costs and applicable labour requirements, as well as clean fuel credit opportunities and the regulatory requirements that apply to your project.

We help you identify gaps in readiness and supporting evidence and understand how the value and timing of credits affect cash flow and funding.

Try the clean energy incentives demo
Discuss your project’s incentive readiness

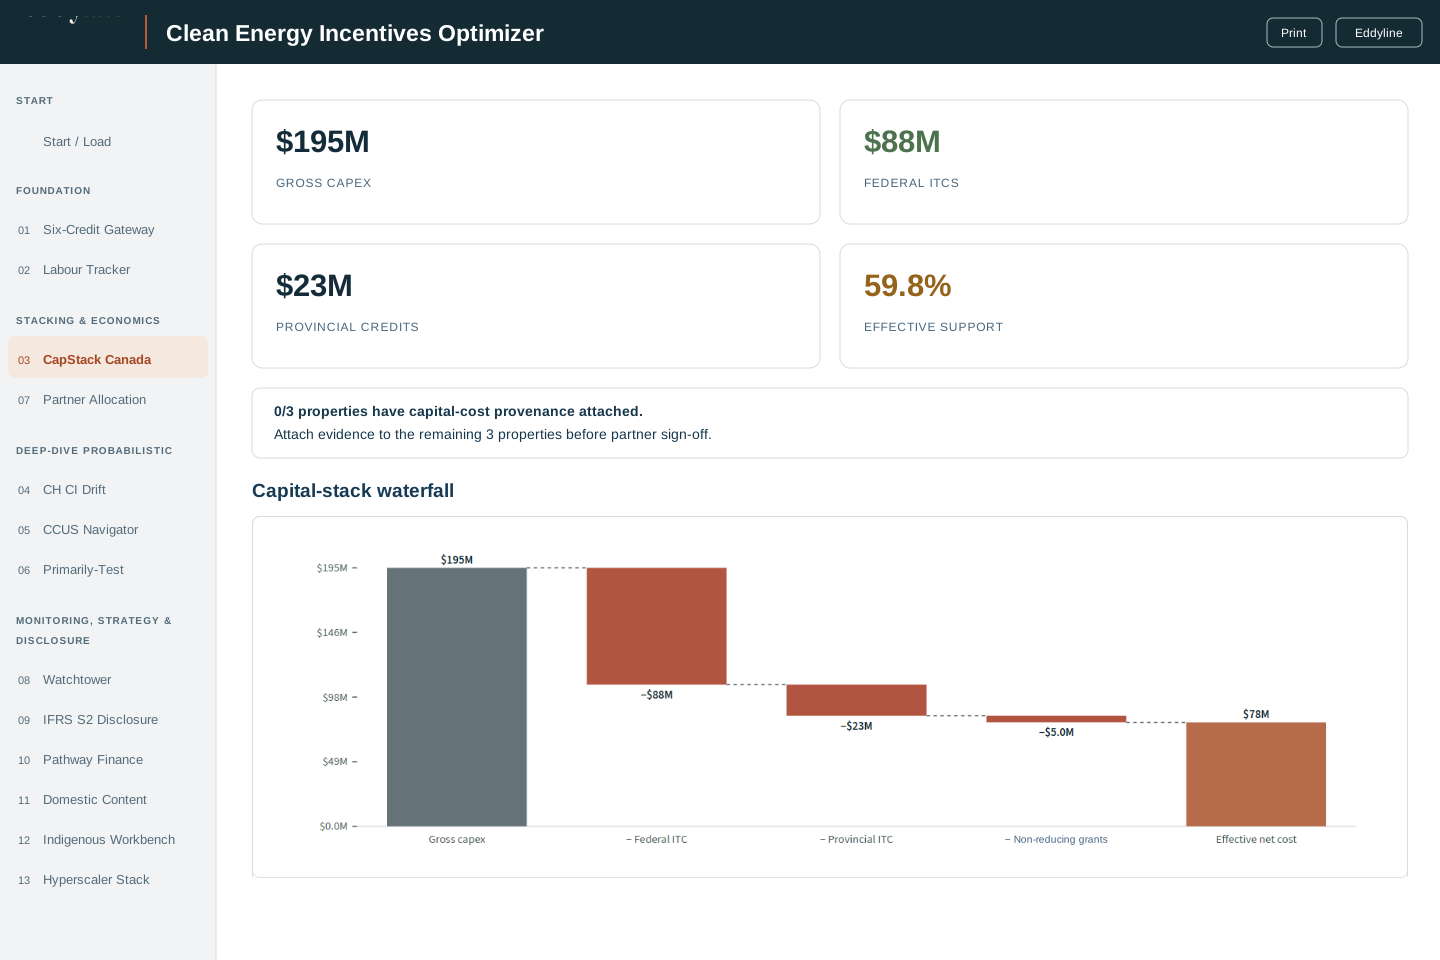
Capital stack view from the Clean Energy Incentives Optimizer showing project costs, federal investment tax credits, provincial credits and non-reducing grants.

Clean Energy Incentives Optimizer

Investment tax credits, clean fuel credits and compliance requirements in one tool.

  • Project readiness
  • Incentive assessment
  • Cash flow analysis
  • Capital planning
From decision to delivery

Turn the pathway into a programme of investment.

We help companies translate transition pathways into capital programmes, investment decisions and performance measures that can evolve as technologies, costs and market conditions change.

A funded plan that can evolve.
  1. 01

    Prioritize

    Agree the investments, dependencies and sequence.

  2. 02

    Fund and approve

    Establish the capital requirements, funding conditions and decision rights.

  3. 03

    Deliver

    Assign owners, milestones and measures tied to the investment case.

  4. 04

    Monitor and adapt

    Track performance and future signposts; revisit commitments when conditions change.
Sequenced programme
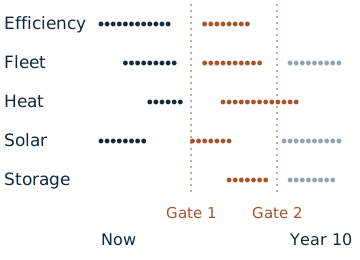
Sequenced programmeEfficiency, fleet, heat, solar and storage progress through committed, planned and optional actions over ten years. Two decision gates allow later commitments to be reviewed. Dots illustrate sequencing, not quantities.EfficiencyFleetHeatSolarStorageGate 1Gate 2NowYear 10
Sequenced programme: the same actions and relative quantities arranged for a small screen.
CommittedPlannedOptional
Capital by year
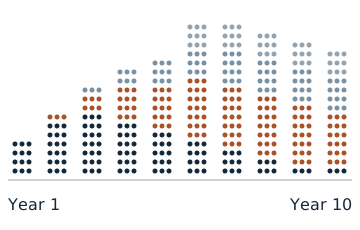
Capital by yearTen annual stacks combine efficiency, electrification, renewables and removals. Initial measures are followed by staged investment and later provisions. Total relative capital rises and then tapers. Dots show relative scale, not currency.Year 1Year 10
Capital by year: the same actions and relative quantities arranged for a small screen.
EfficiencyElectrificationRenewablesRemovals
Pipeline to plan
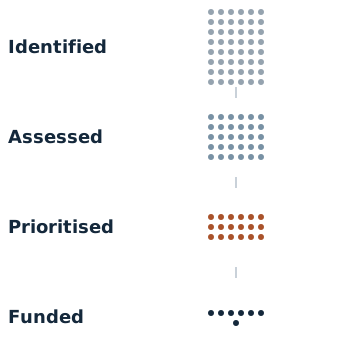
Pipeline to planA broad set of identified actions is assessed, prioritised and narrowed to a funded programme. The shrinking dot groups illustrate selection rather than counts of projects.IdentifiedAssessedPrioritisedFunded
Pipeline to plan: the same actions and relative quantities arranged for a small screen.

Keep the transition plan moving.

Revisit project priorities, capital needs and delivery progress as technologies, costs and market conditions change.

Explore climate investment support